
Investing Basics
Click on image to enlarge
Diversification
The simplest way to control risk is to diversify.
It is common sense that holding multiple risky investments reduces your losses from any single investment that goes bad. In the financial world, we can actually measure the impact of diversification using the statistical concept of Standard Deviation.
Standard Deviation is a measure of volatility that expresses how much a particular investment’s returns on average depart from its average return (both positively and negatively). For investments that have regular, measurable returns it is the predominant statistic used to express the risk of an investment.
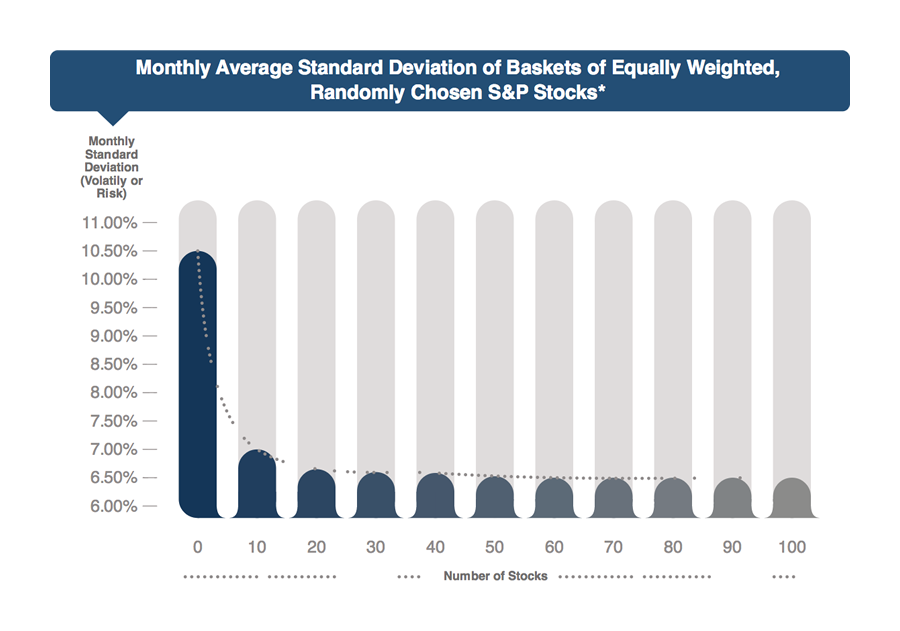
The chart below shows the average standard deviation of various portfolios of stocks that have been randomly chosen from the Standard & Poors 500 Index. The primary difference between the portfolios is the number of stocks included. The chart illustrates dramatically how quickly the volatility of portfolio returns can be reduced through diversification.
Funds versus Securities
Funds Offer Efficient Diversification
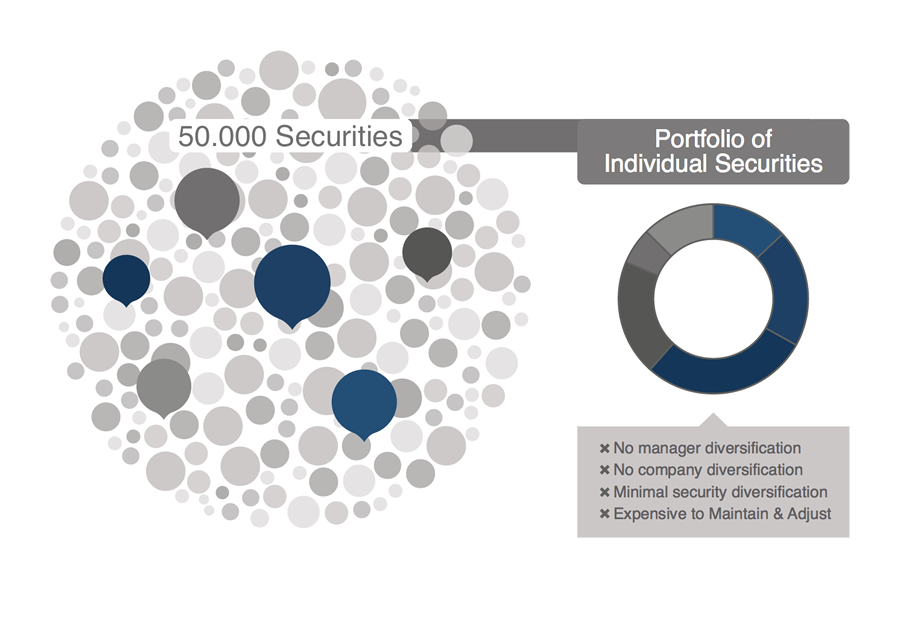
As our discussion on diversification indicates, a portfolio maximizes the risk reducing effects of diversification by holding a minimum of 30-40 individual stocks. Obviously, the first issue is which stocks to pick. There are almost 50,000 stocks traded on the over 50 stock exchanges throughout the world, a daunting task for anyone. But stock-picking is just the first step in managing a global portfolio of stocks. A diligent manager will not only decide how much to invest in individual stocks, but how much to put in each country, currency, industry, capitalization (company size), and equity style (growth vs. value).
Portfolio construction can be likened to building a complex machine, like an automobile. Like a car, it is made of hundreds of individual parts, each with its own purpose. Some parts are intended to provide forward momentum, others are there for safety. For the first cars, each part was custom made at great cost because there were no suppliers for individual parts. As the auto industry matured, part suppliers specializing in individual components proliferated and competition forced innovation as well as price declines.
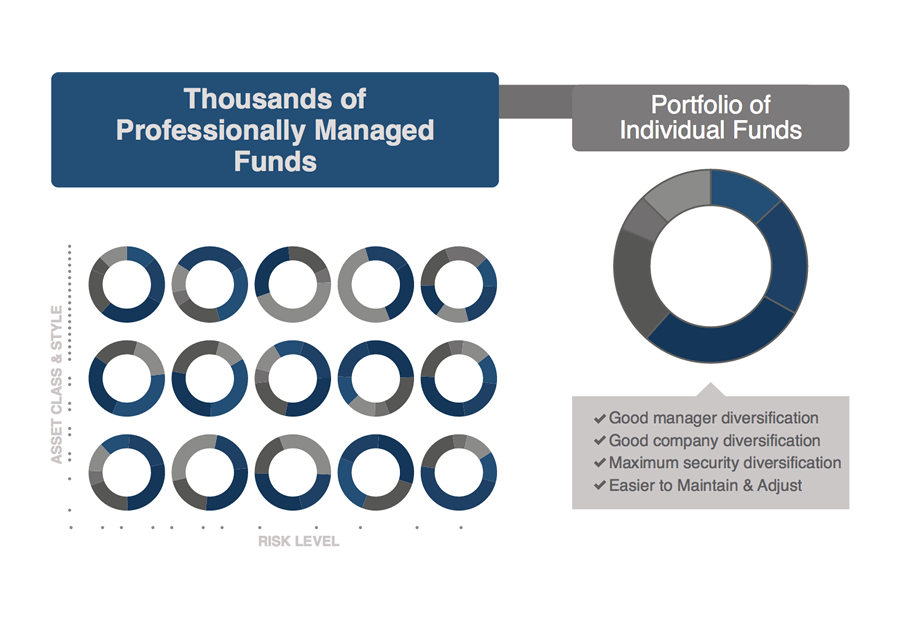
Modern car manufactures now produce a superior product at a lower price by engineering it with mass produced parts from the best outside suppliers. The same is true in modern portfolio construction. There are now thousands of individual funds focusing on each specialized market segment. A skilled “engineer” can now find the best possible management for each piece in order to build a superior portfolio that is far less expensive than the custom built ones of a just a few decades ago.
This type of portfolio engineering is possible because the mutual fund industry has become mature and well established. Numerous commercial databases exist that allow professional investors to compare, rank and discover mutual funds with a dizzying array of managers, fund companies, investment strategies, countries and markets. Professional investors have access to the skilled managers around the globe and can analyze funds to find those that provide the best return, risk and cost characteristics for each client portfolio’s specific needs.
The wealth of information available on mutual funds is mainly due to the investment and disclosure requirements imposed on fund issuers by the various government regulatory organizations overseeing them. The highly regulated nature of the global mutual fund marketplace makes it one of the safest, most efficient and transparent ways to invest.
Added to the above benefits are two more layers of diversification: manager risk and company risk. By spreading a portfolio’s investments out among different companies, the risk associated with any single company or bank’s operations is greatly limited.
Click on image to enlarge
Click on image to enlarge
Click on image to enlarge
Asset Allocation
Asset Allocation, in the broadest sense, is primarily a risk setting exercise.
Generally investments with very different risk and return expectations are classified as different “Assets.” For example, Bonds typically have much lower volatility and return than Stocks and are therefore considered separate Assets or Asset Classes. The term “Asset Allocation” refers to the amounts an investor has dedicated to these various Asset Classes.
In 1986, Gary P. Brinson, L. Randolph Hood, and Gilbert L. Beebower (BHB) published a, now infamous, study on the effects of asset allocation on investment return. A popular sound-bite that arose from the BHB study was some variation of, “over 90% of return comes from asset allocation.” Although catchy, this subtly clouds the truth as the more correct take-away from the study would have been that over 90% of return is due to the amount of risk in a portfolio.
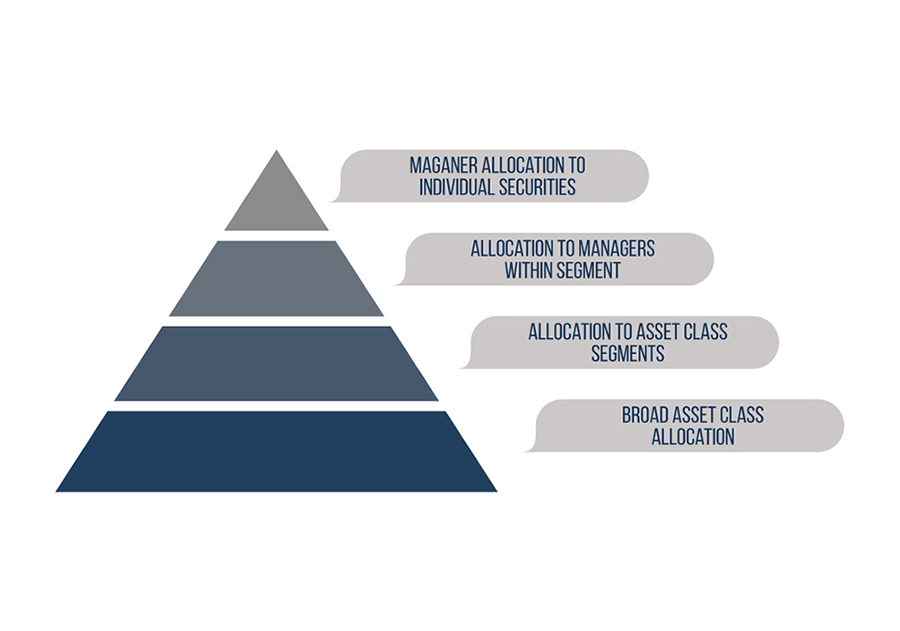
How much risk an investor is willing to tolerate in their quest for return will determine the lion’s share of their Asset Allocation. Often confusion arises because “allocation” actually occurs on multiple levels in the portfolio building process. The figure to the right shows some of the major portfolio allocations that normally occur. The complexity of each level of allocation tends to increase as you move up the pyramid, requiring higher degrees specialized information and in-depth knowledge and experience.
Click on image to enlarge
Segment Allocation
After deciding on the level of risk that is appropriate to an investor’s circumstances, and therefore the suitable Asset Class Allocation, the next set of choices deals with how much to invest in each segment within asset classes.
Segments vary by Broad Asset Class. The table below provides some examples of the segments Prudens uses for its segment level allocations.
Standard Deviation is a measure of volatility that expresses how much a particular investment’s returns on average depart from its average return (both positively and negatively). For investments that have regular, measurable returns it is the predominant statistic used to express the risk of an investment.
The chart below shows the average standard deviation of various portfolios of stocks that have been randomly chosen from the Standard & Poors 500 Index. The primary difference between the portfolios is the number of stocks included. The chart illustrates dramatically how quickly the volatility of portfolio returns can be reduced through diversification.
"To observe how people of prudence, discretion and intelligence manage their own affairs, not in regard to speculation, but in regard to the permanent disposition of their funds, considering the probable income, as well as the probable safety of the capital to be invested.”
The Prudent Rule